Rich tasks
- This task asks students to take part in an Enquiry Cycle and conduct a survey to find the answers to a question about their class.
This task can be given at the start of a topic or done as the students gain enough understanding to complete it.
My class
> More on "Rich tasks for this Chapter"...
1. My class
- Some students may still need support to develop their enquiry. You could share ideas about what sorts of information would be needed to answer each of the questions, how it might be collected and what types of graph might be best to display different types of information.
- Arranging the task so that students work with a partner or in a mixed ability group will encourage students to consider the task from a range of perspectives and support students who might otherwise struggle to complete the task successfully.
- Tracking the progress of students or groups as they conclude each stage of the Enquiry Cycle will ensure that students continue to make progress through the cycle, and help to identify those who require additional support.
- Allow adequate time for students to present their displays and report their findings. As part of this you could also ask some questions about their experience of the Enquiry Cycle. For example, were there any unexpected difficulties? Did their investigation raise any other questions they would like to find the answers to? Would they do anything differently next time?
Collecting data page 290
- Differentiate between categorical and numerical data.
- Know how each type of data can be collected.
- Collect data using choice cards, tally charts and frequency tables, and dot plots.
> More on "Collecting data"...
Teacher note
- Different types of data are collected and displayed in different ways.
- Categorical data is data that can be put into groups with names. Categorical data can be collected using choice cards and tally charts, and can be displayed on pictograms, bar charts, pie graphs, dot plots or strip graphs.
- Numerical data is data that represents a quantity. Numerical data can be collected on choice cards, tally charts, dot plots or stem and leaf plots.
A tally chart is useful for collecting data from different categories, especially where the data arises randomly or over time. Students need to know when it is appropriate to use a tally chart, and when another method, for example, taking a vote or counting, would be more efficient.
- One tally mark is used for each occurrence, and these are grouped in 5s.
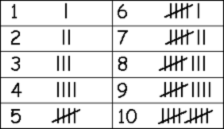
Students should be encouraged to instantly recognise this configuration as 5 without the need to count them. Encourage students to convert marks on tally graphs to the total or frequency by using x 5 tables or by skip counting rather than counting each mark. - Choice cards are an easy and efficient way to collect categorical or numerical data, as they can easily be sorted and counted in different ways.
- Dot plots are useful for small data sets. It is important that dots align and are evenly spaced. Using grid paper is very helpful.
Drawing graphs page 293
- Draw bar charts, pictograms, strip graphs, and pie charts (using choice cards or by making a circle from a strip graph) to display categorical or numerical data.
- Make conclusions about data recorded on different charts, plots and graphs.
> More on "Drawing graphs"...
Teacher note
- It is important to spend time explicitly discussing the information which needs to be included on each type of graph. You could display a checklist so that students can check that the appropriate information is on their displays.
Analysing other people’s data page 297
- Answer questions about other people’s surveys.
> More on "Analysing other people’s data"...
Teacher note
- It is important that students are given displays which show the results of investigations about contexts they are familiar with in real-life.
- It is important to ask students questions that can be answered using a display that someone else has drawn and insist on students using mathematical language to answer the questions.
- Statements that students make about the data must be connected to the original question or assertion and use information from the display. This is the purpose of an investigation and keeps the investigation focused. There might be other information they discover, but the statements must answer the question or assertion.
- Encourage students to be specific about frequency, for example, “3 more students have cats than dogs”. Ask them to use their knowledge about the context to explain the data, for example. “More students have cats because they are less expensive and easier to care for than dogs”.
- You could enter the data gathered by students, onto a spreadsheet to quickly create a range of displays. For example, pictographs, bar and strip graphs, pie charts and dot plots. Students can then discuss which displays it is easier to find information on.
The Enquiry Cycle page 304
- Use the Enquiry Cycle to investigate the answer to a question or test an assertion.
- Be able to describe what happens at each step of the cycle.
> More on "The enquiry cycle"...
Teacher note
- The Enquiry Cycle is not a step-by-step cycle, often it involves going back to different points in the cycle, to rethink and make changes to the initial plan. It is very important to encourage students to carefully plan before they begin an investigation. It is helpful if teachers model and are ready to provide support where needed for each step of the Enquiry Cycle, including going back to previous steps when necessary.
- It is important that contexts chosen for investigations are familiar to students so that they can be encouraged to pose their own questions, decide which data they will need to collect and how they might go about doing this. Students should be directed to link their findings back and answer the question they had at the beginning of the Enquiry Cycle.
- It is helpful to give students opportunity to to critically reflect on what they learned during the process of the Enquiry Cycle through discussion about the effectiveness of each step, the quality of their results, and how well these have been communicated. You might ask your students to think about what they might change if they were to do the same survey again.
- When students undertake the same investigation it is useful for them to compare how they went about the investigation and discuss any problems they had, the displays chosen and the conclusions made.