Rich tasks
- The class party
> More on "Rich tasks for this Chapter"...
1. The class party
- Arranging the task so that students work with a partner or in mixed ability groups will encourage students to consider the task from a range of perspectives and support students who might otherwise struggle to complete the task successfully.
- Students will probably need support and guidance to develop their enquiry. You could share ideas and help them refine their choices about what sorts of information would be needed to be able to have a class party, how it might be collected, and what types of graph might be best to display different types of information. Students at this level are not expected to be able to conduct an Enquiry without some assistance from their teacher.
- Tracking the progress of students or groups as they conclude each stage of the Enquiry Cycle will ensure that students continue to make progress through the cycle and help to identify those who require additional support.
- Allow adequate time for students to share their displays and report their findings. As part of this you could also ask some questions about their experience of the Enquiry Cycle. For example, were there any unexpected difficulties? Did their investigation raise any other questions they would like to find the answers to? Would they do anything differently next time? Was the graph they made the best graph to show the information they had collected?
The Enquiry Cycle page 280
- Understand that the Enquiry Cycle is an iterative process that can be used to carry out a survey.
- Describe what happens at each step of the cycle.
> More on "The Enquiry Cycle"...
Teacher notes
- The Enquiry Cycle is not a step by step repetitive cycle, but often involves going back to different points in the cycle, to rethink. It is very important to encourage students to carefully plan before they begin an investigation. It is helpful if teachers model each step of the Enquiry Cycle, including going back to previous steps when necessary.
- It is important that contexts chosen for investigations are familiar to students so that they can be encouraged to pose their own questions, decide which data they will need to collect and how they might go about doing this. Students should be encouraged to link their findings back and answer the question they had at the beginning of the Enquiry Cycle, ie Have I answered my question?
- At Level 1 students are introduced to the Enquiry Cycle using categorical data. Students will be asked to sort and re-sort information into different groups by one shared attribute. Counting is used to find similarities and differences. At Level 2 students will be carrying out investigations that will include categorical and numerical data Numerical data is collected as whole numbers or measurements to the nearest whole unit (e.g. How many white cars drove past? or How far, to the nearest metre, can a Year 3 student throw a tennis ball?)
- Many students will still need significant support at the beginning of Level 2 to complete a cycle successfully. You could model each step for students initially.
- Displays allow data to be easily compared, so that similarities and differences are communicated clearly. Suitable displays at this level for students to create are pictographs, bar and strip graphs and dot plots. Students can also draw conclusions from pie graphs drawn by others.
- It is important that students are encouraged to critically reflect on the process of the Enquiry Cycle, the quality of their results, and how well these have been communicated.
Choice cards and graphs page 281
- Use choice cards to collect data.
- Create graphs using choice cards to display data.
- Justify their choice of graph.
> More on "Choice cards and graphs"...
Teacher notes
- Choice cards are an easy and efficient way to collect categorical or numerical data, as they can easily be sorted, counted or organised into a pictograph, strip, bar graph or pie chart for display.
- In the practical “Choices” on page 284 of the Student Resource Book, encourage students to take photos of their graphs for easy comparison.
Tally charts page 286
- Use a tally chart to collect data.
- Interpret data recorded on a tally chart.
- Know when a tally chart is appropriate for data collection.
> More on "Tally charts"...
Teacher notes
- A tally chart is useful for collecting data from different categories, especially where the data arises randomly or over time. Students need to know when it is appropriate to use a tally chart, and when another method, for example taking a vote or counting, would be more efficient.
- One tally mark is used for each occurrence, and these are commonly grouped in 5s.
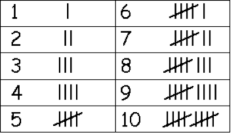
Students should be encouraged to instantly recognise (or subitise) this configuration as 5 without the need to count each mark. Students may use skip counting or multiplication to total tally marks.
You might like to explore why tally marks are grouped in 5s rather than some other number.
Dot plots for number data page 288
- Record and interpret numerical data on a dot plot.
> More on "Dot plots for number data"...
Teacher notes
- Dot plots are useful for small data sets. When used for numerical data the numbers on the scale come one after the other with no gaps, for example, 1, 2, 3, 4, 5,… . It is important that dots align and are evenly spaced. Using grid paper is very helpful.
- Dot plots make it very easy for children to identify relative frequency of data points (“most” / “least”), and also to identify the range of the data (“between”). They may also identify outliers (single data points away from the main cluster).
- For the discussion on page 288, you might need to direct the observations by asking questions such as
- What do the 6 six dots above number 7 mean?
- Why are there no dots above some numbers?
- What is the most hours watched by someone in room 8?
- There is one dot above number 0. Why might this be?
- Which is the most common number of hours room 8 students watch TV?
- What else does the dot plot show about room 8s TV watching?
Other people’s surveys page 289
- Interpret and answer questions about other people’s surveys and displays.
> More on "Other people’s surveys"...
Teacher notes
- It is important that students are given displays which show the results of investigations about contexts they are familiar with in real-life.
- Asking questions or making comments during whole class or small group discussion about the displays of others can be used as a first step towards independently interpreting data displays.
- Comparing displays with a peer who has undertaken a similar investigation with different data, will also help students to make sense of others’ displays.
- Statements that students make about the data should be connected to the original question or assertion and use information from the display.
- At this level, students will focus on comparison between categories (“more than” / “less than” / “the same as”).
- Encourage students to be specific about frequency. For example, “Three more students have cats than dogs”. Ask them to use their knowledge about the context to explain the data. For example, “More students have cats because they are less expensive and easier to care for than dogs”.
- You could enter the data gathered by students, into a spreadsheet to quickly create a range of displays (e.g. pictographs, bar and strip graphs, pie charts and dot plots). Students can then discuss which graphs are best to answer each question.
- To extend question 4 of Activity 3, you could ask students to write a question of their own using the information on the graph and give it to their partner to answer.